|
|
||
|---|---|---|
| .. | ||
| data | ||
| doc | ||
| src | ||
| .project | ||
| README.md | ||
| pom.xml | ||
README.md
jzy3d-tutorials
This module provides examples on how to create basic charts with Jzy3d.
For more example, refer to the complete developer guide.
For more documentation about the framework design, see the API Readme file.
Adding dependencies
See pom.xml file as an example.
Add reference to Jzy3d Maven repository
<repositories>
  <repository>
    <id>jzy3d-snapshots</id>
    <name>Jzy3d Snapshots</name>
    <url>https://maven.jzy3d.org/snapshots/</url>
  </repository>
  <repository>
    <id>jzy3d-releases</id>
    <name>Jzy3d Releases</name>
    <url>https://maven.jzy3d.org/releases/</url>
  </repository>
</repositories>
Add dependencies for native charts
These are the dependencies to use by default to enable JOGL Native Charts on Jzy3d.
<dependencies>
  <dependency>
    <groupId>org.jzy3d</groupId>
    <artifactId>jzy3d-native-jogl-awt</artifactId>
    <version>2.0.0-SNAPSHOT</version>
  </dependency>
  <dependency>
    <groupId>org.jzy3d</groupId>
    <artifactId>jzy3d-native-jogl-swing</artifactId>
    <version>2.0.0-SNAPSHOT</version>
  </dependency>
  <dependency>
    <groupId>org.jzy3d</groupId>
    <artifactId>jzy3d-native-jogl-newt</artifactId>
    <version>2.0.0-SNAPSHOT</version>
  </dependency>
  <dependency>
    <groupId>org.jzy3d</groupId>
    <artifactId>jzy3d-native-jogl-swt</artifactId>
    <version>2.0.0-SNAPSHOT</version>
  </dependency>

  <dependency>
    <groupId>org.jzy3d</groupId>
    <artifactId>jzy3d-tester-native</artifactId>
    <version>2.0.0-SNAPSHOT</version>
    <!-- not scoped test to demonstrate DebugGL in src/main/java -->
  </dependency>
</dependencies>
Add dependencies for emulated charts
These are the dependencies to use to enable jGL Emulated OpenGL Charts on Jzy3d.
<dependencies>
  <dependency>
      <groupId>org.jzy3d</groupId>
      <artifactId>jzy3d-emul-gl-awt</artifactId>
      <version>2.0.0-SNAPSHOT</version>

  </dependency>

  <dependency>
    <groupId>org.jzy3d</groupId>
    <artifactId>jzy3d-tester</artifactId>
    <version>2.0.0-SNAPSHOT</version>
    <scope>test</scope>
  </dependency>

</dependencies>
Note that Emulated charts and native charts can both appear in the path.
The below map better illustrate how the API is splitted into Maven modules.

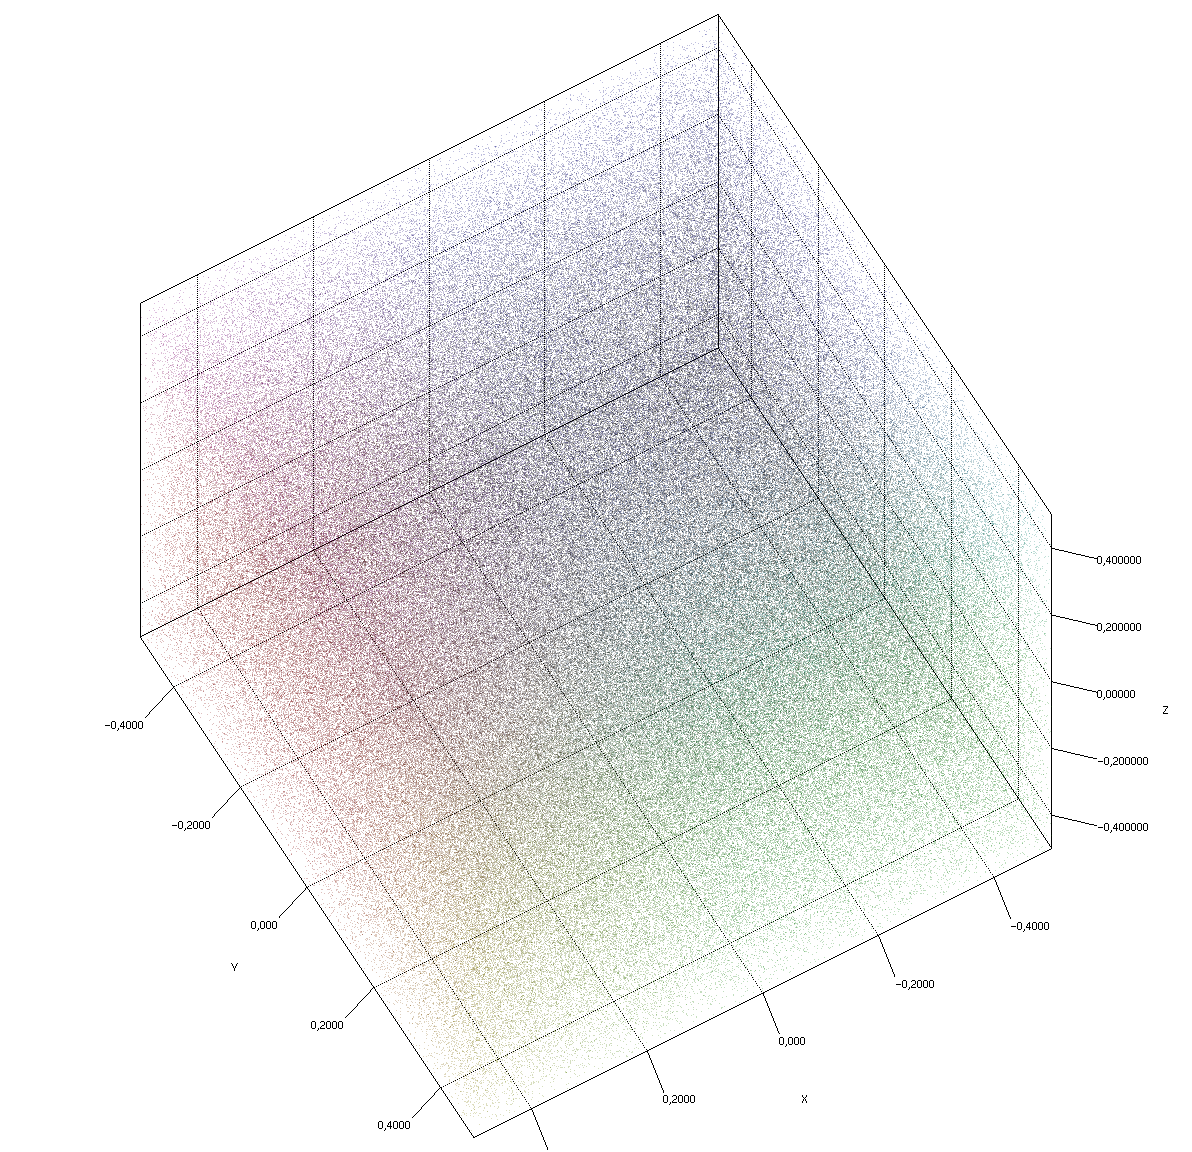
Scatter charts
See ScatterDemo
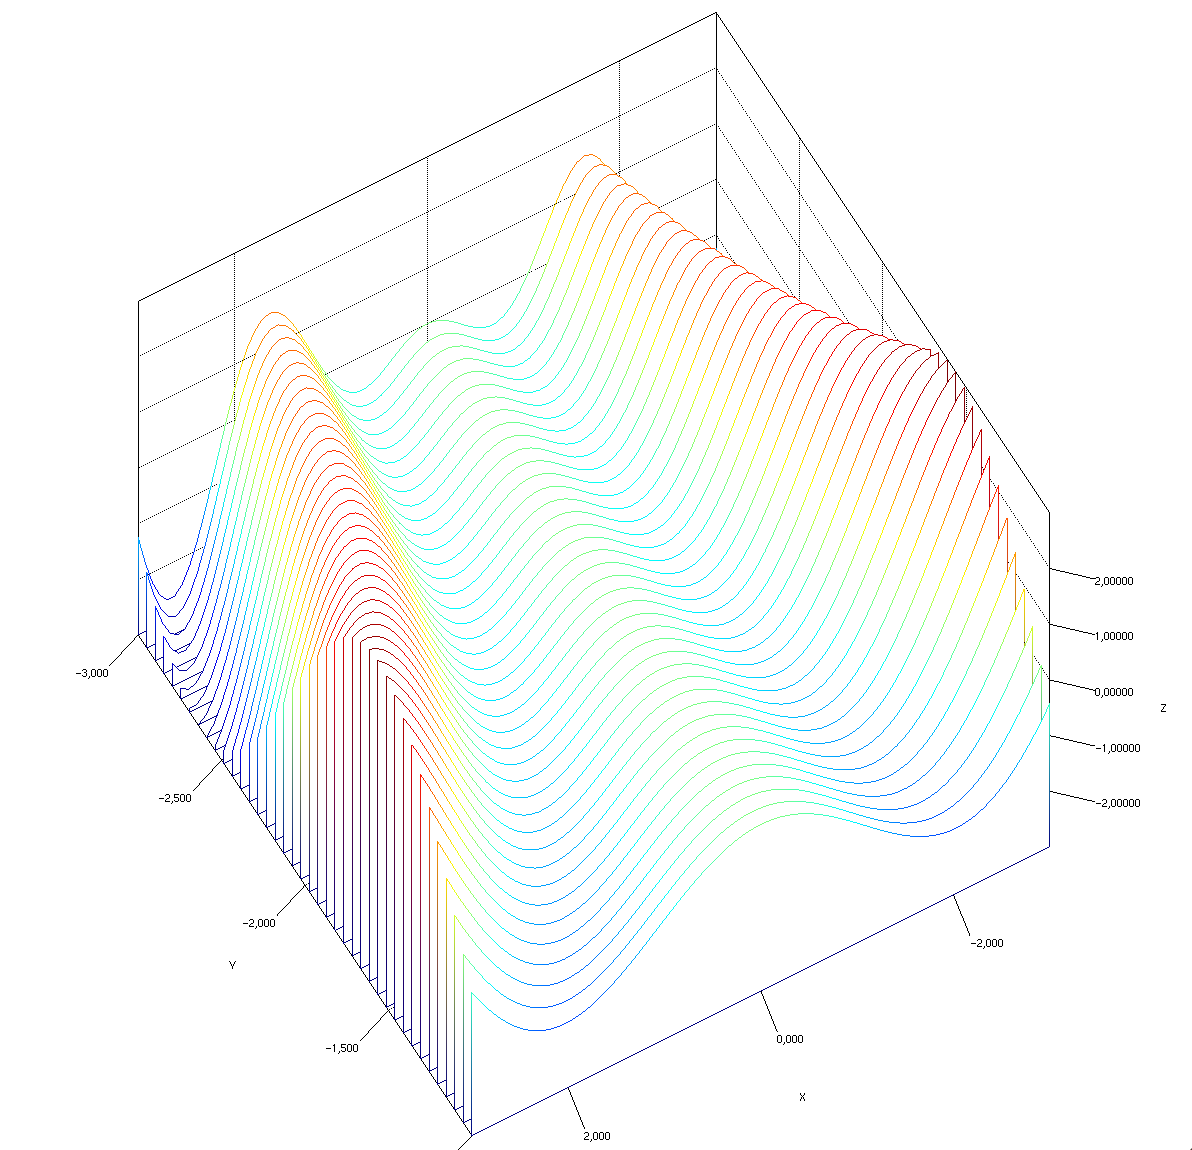
Surface charts
See SurfaceDemoAWT

Waterfall charts
See WaterfallDemo
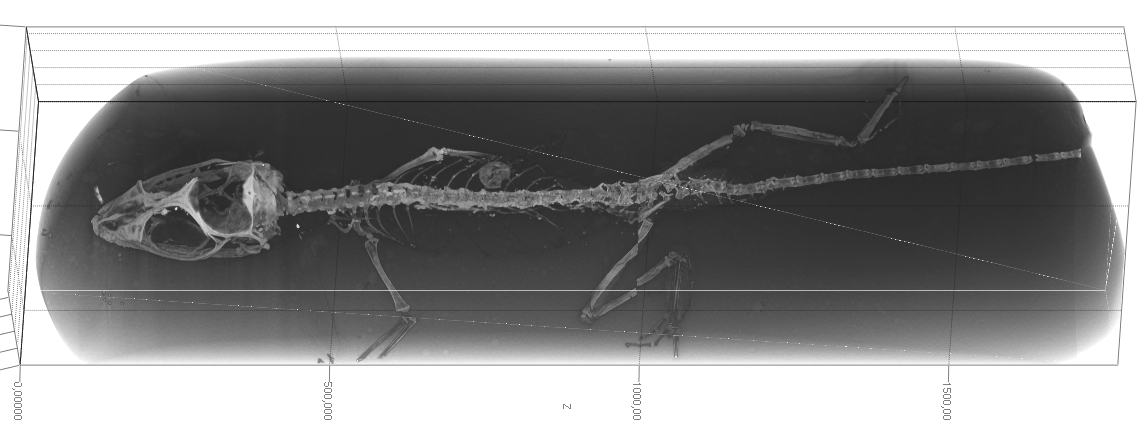
Volume charts
See LizardVolumeDemo
2D Line charts
See Chart2DDemo

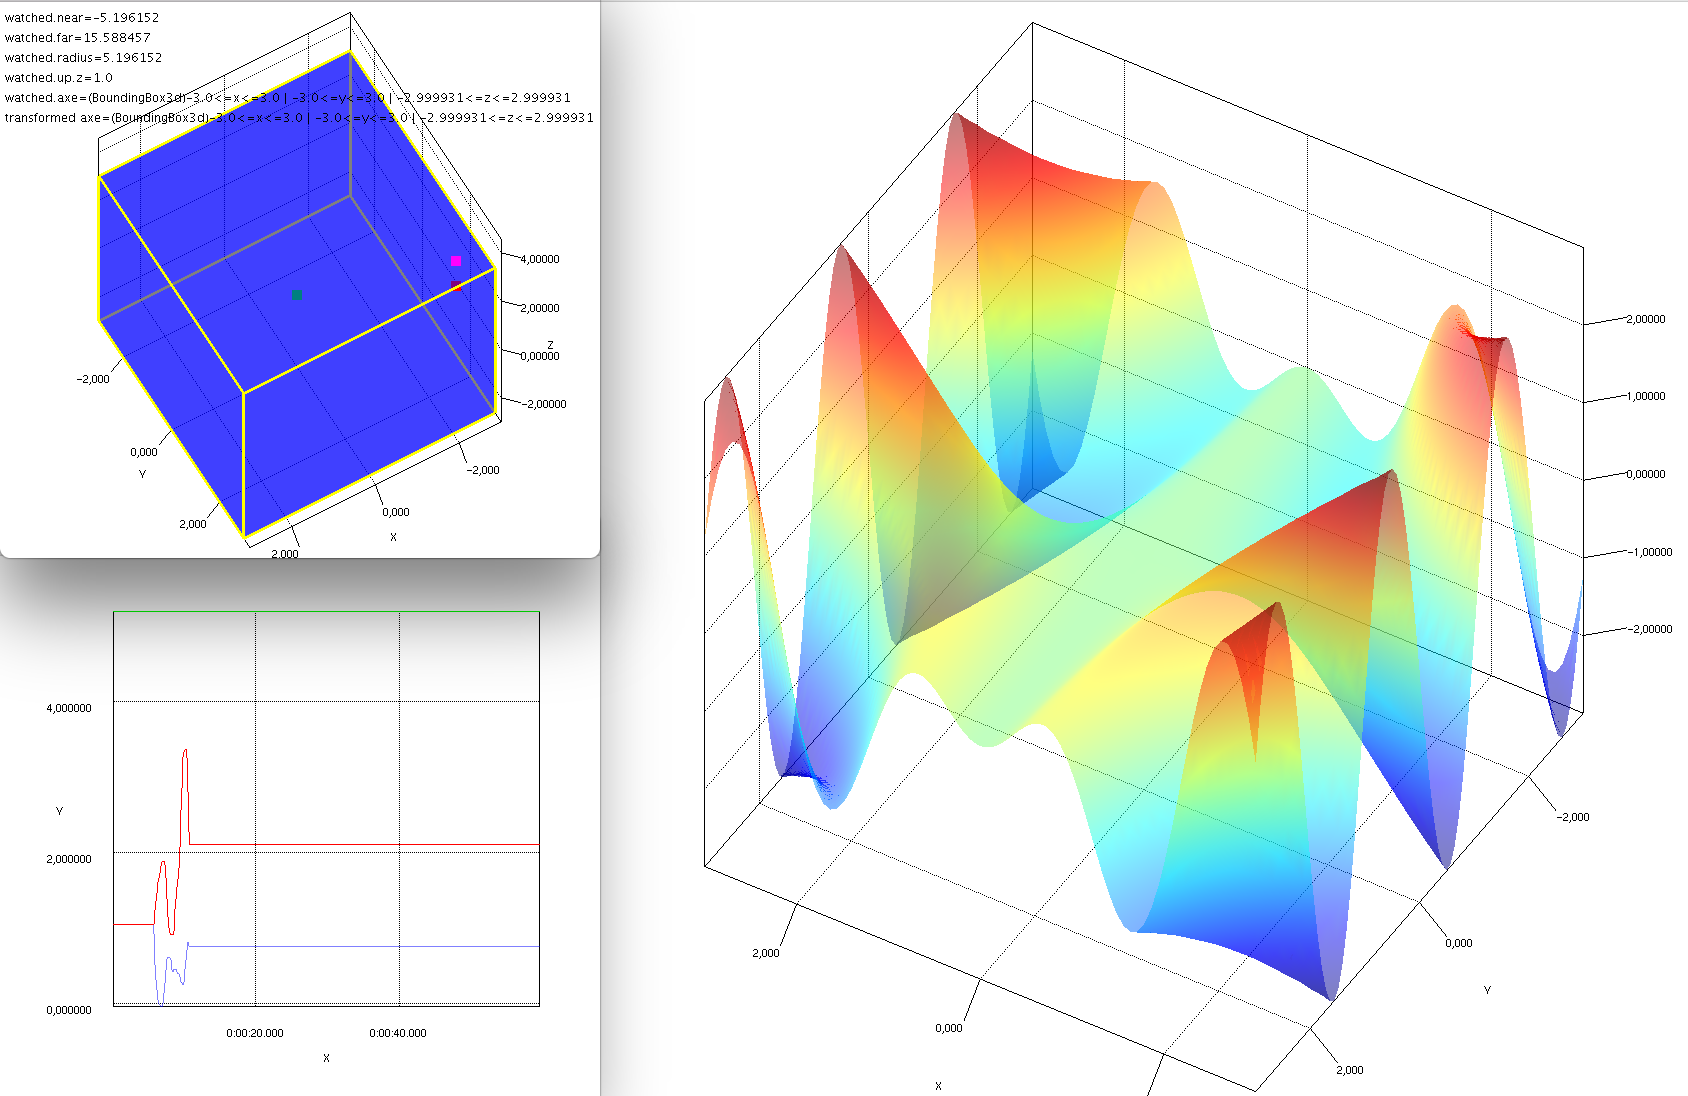
Debug charts
See DebugGL_Demo and modules jzy3d-tester, jzy3d-tester-native
Test charts
See ITTestNativeSurfaceChart and ITTestNativeScatterChart for examples unit test showing how to verify no regression on a chart based on a pixel-wise comparison of the chart with a previously generated screenshot stored in src/test/resources.
See ChartTester README page for more information on Chart testing.

More charts
For more example, refer to the complete developer guide.