|
|
||
|---|---|---|
| .. | ||
| cloud-function | ||
| dashboards | ||
| tests | ||
| LICENSE | ||
| README.md | ||
| main.tf | ||
| metric.png | ||
| variables.tf | ||
| versions.tf | ||
README.md
Networking Dashboard
This repository provides an end-to-end solution to gather some GCP Networking quotas and limits (that cannot be seen in the GCP console today) and display them in a dashboard. The goal is to allow for better visibility of these limits, facilitating capacity planning and avoiding hitting these limits.
Here is an example of dashboard you can get with this solution:
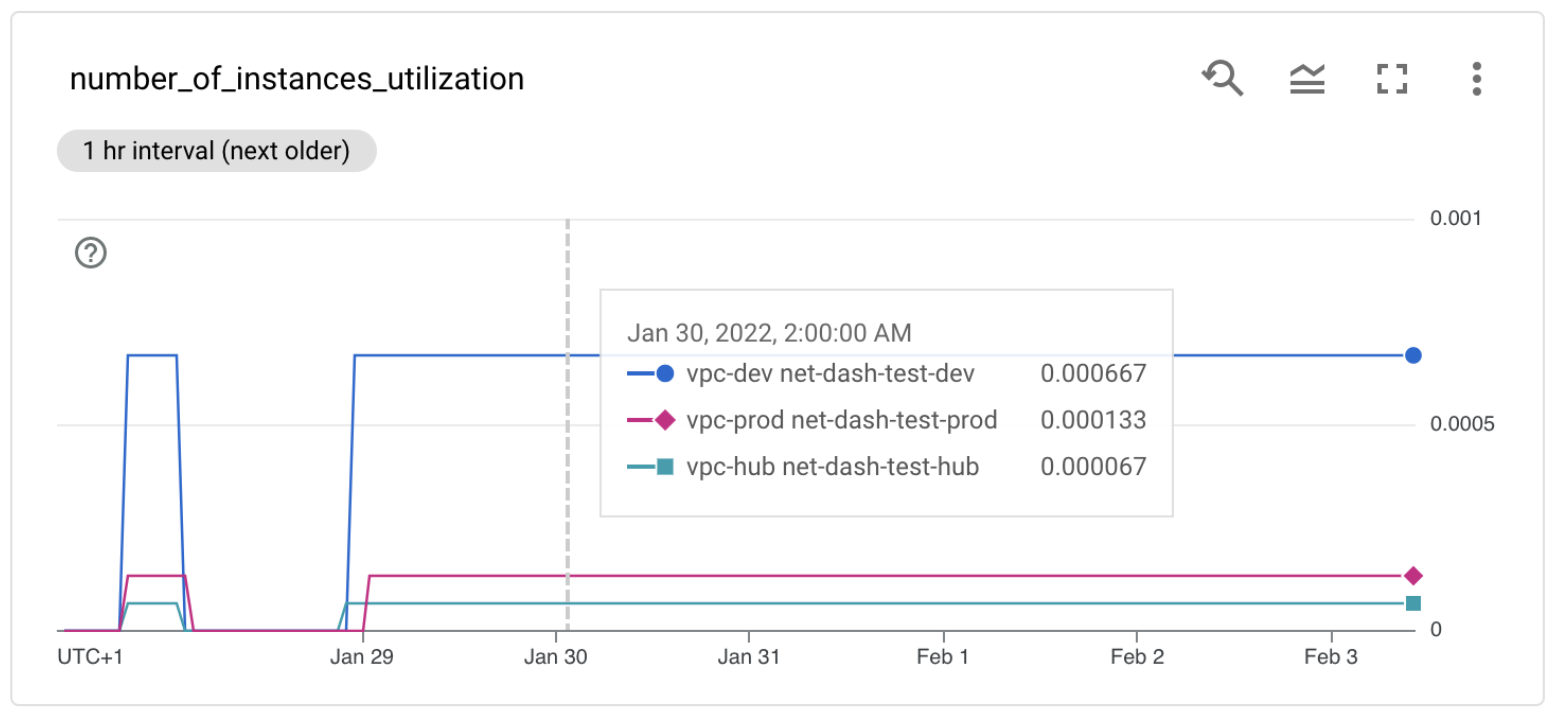
Here you see utilization (usage compared to the limit) for a specific metric (number of instances per VPC) for multiple VPCs and projects.
Three metric descriptors are created for each monitored resource: usage, limit and utilization. You can follow each of these and create alerting policies if a threshold is reached.
Usage
Clone this repository, then go through the following steps to create resources:
- Create a terraform.tfvars file with the following content:
organization_id         = "<YOUR-ORG-ID>"
billing_account         = "<YOUR-BILLING-ACCOUNT>"
monitoring_project_id   = "project-0"               # Monitoring project where the dashboard will be created and the solution deployed
monitored_projects_list = ["project-1", "project2"] # Projects to be monitored by the solution
monitored_folders_list  = ["folder_id"]             # Folders to be monitored by the solution
v2                      = false                     # Set to true to use V2 Cloud Functions environment
terraform initterraform apply
Note: Org level viewing permission is required for some metrics such as firewall policies.
Once the resources are deployed, go to the following page to see the dashboard: https://console.cloud.google.com/monitoring/dashboards?project=. A dashboard called "quotas-utilization" should be created.
The Cloud Function runs every 10 minutes by default so you should start getting some data points after a few minutes. You can use the metric explorer to view the data points for the different custom metrics created: https://console.cloud.google.com/monitoring/metrics-explorer?project=. You can change this frequency by modifying the "schedule_cron" variable in variables.tf.
Note that some charts in the dashboard align values over 1h so you might need to wait 1h to see charts on the dashboard views.
Once done testing, you can clean up resources by running terraform destroy.
Supported limits and quotas
The Cloud Function currently tracks usage, limit and utilization of:
- active VPC peerings per VPC
- VPC peerings per VPC
- instances per VPC
- instances per VPC peering group
- Subnet IP ranges per VPC peering group
- internal forwarding rules for internal L4 load balancers per VPC
- internal forwarding rules for internal L7 load balancers per VPC
- internal forwarding rules for internal L4 load balancers per VPC peering group
- internal forwarding rules for internal L7 load balancers per VPC peering group
- Dynamic routes per VPC
- Dynamic routes per VPC peering group
- Static routes per project (VPC drill down is available for usage)
- Static routes per VPC peering group
- IP utilization per subnet (% of IP addresses used in a subnet)
- VPC firewall rules per project (VPC drill down is available for usage)
- Tuples per Firewall Policy
It writes this values to custom metrics in Cloud Monitoring and creates a dashboard to visualize the current utilization of these metrics in Cloud Monitoring.
Note that metrics are created in the cloud-function/metrics.yaml file. You can also edit default limits for a specific network in that file. See the example for vpc_peering_per_network.
Assumptions and limitations
- The CF assumes that all VPCs in peering groups are within the same organization, except for PSA peerings
- The CF will only fetch subnet utilization data from the PSA peerings (not the VMs, ILB or routes usage)
- The CF assumes global routing is ON, this impacts dynamic routes usage calculation
- The CF assumes custom routes importing/exporting is ON, this impacts static and dynamic routes usage calculation
- The CF assumes all networks in peering groups have the same global routing and custom routes sharing configuration
Next steps and ideas
In a future release, we could support:
- Google managed VPCs that are peered with PSA (such as Cloud SQL or Memorystore)
- Dynamic routes calculation for VPCs/PPGs with "global routing" set to OFF
- Static routes calculation for projects/PPGs with "custom routes importing/exporting" set to OFF
- Calculations for cross Organization peering groups
- Support different scopes (reduced and fine-grained)
If you are interested in this and/or would like to contribute, please contact legranda@google.com.
Variables
| name | description | type | required | default |
|---|---|---|---|---|
| billing_account | The ID of the billing account to associate this project with | |
✓ | |
| monitored_projects_list | ID of the projects to be monitored (where limits and quotas data will be pulled) | list(string) |
✓ | |
| organization_id | The organization id for the associated services | |
✓ | |
| prefix | Customer name to use as prefix for monitoring project | |
✓ | |
| cf_version | Cloud Function version 2nd Gen or 1st Gen. Possible options: 'V1' or 'V2'.Use CFv2 if your Cloud Function timeouts after 9 minutes. By default it is using CFv1. | |
V1 |
|
| monitored_folders_list | ID of the projects to be monitored (where limits and quotas data will be pulled) | list(string) |
[] |
|
| monitoring_project_id | Monitoring project where the dashboard will be created and the solution deployed; a project will be created if set to empty string | |
||
| project_monitoring_services | Service APIs enabled in the monitoring project if it will be created. | |
[…] |
|
| region | Region used to deploy the cloud functions and scheduler | |
europe-west1 |
|
| schedule_cron | Cron format schedule to run the Cloud Function. Default is every 10 minutes. | |
*/10 * * * * |