44 lines
2.6 KiB
Markdown
44 lines
2.6 KiB
Markdown
# Performance Tracing
|
|
|
|
rusEFI has build-in provisions for performance tracing
|
|
|
|
Whenever certain events occur, a few things are logged to a buffer:
|
|
|
|
- Event type (function name, etc)
|
|
- Current thread
|
|
- Current interrupt number (if not in a thread)
|
|
- Timestamp in cycles (note: this is a 32-bit timestamp, so at 168MHz, it overflows every 25 seconds. This is fine, as the trace buffer is only long enough for 10-100 ms of events, depending on CPU load)
|
|
|
|
This data is then transported to a PC, and reconstructed in to an easy-to-read format.
|
|
|
|
Uses:
|
|
|
|
- Performance optimization
|
|
- Where did the time go? Are we running out of CPU? Is a particular interrupt or thread getting in the way often?
|
|
- Is the interrupt/thread priority set properly? Are things getting preempted as expected?
|
|
|
|
## Capturing a Trace
|
|
|
|
Use "Grab PTrace" button in rusEFI console, this would request a 500ms performance trace from ECU and write it into a .json file.
|
|
Use the W/A/S/D keys to move left, right, or zoom in and out.
|
|
|
|
Open Google Chrome browser, open chrome://tracing/, load generated .json file.
|
|
|
|
## Interpreting a Trace
|
|
|
|
Here is an example of a trace:
|
|
|
|
|
|
|
|
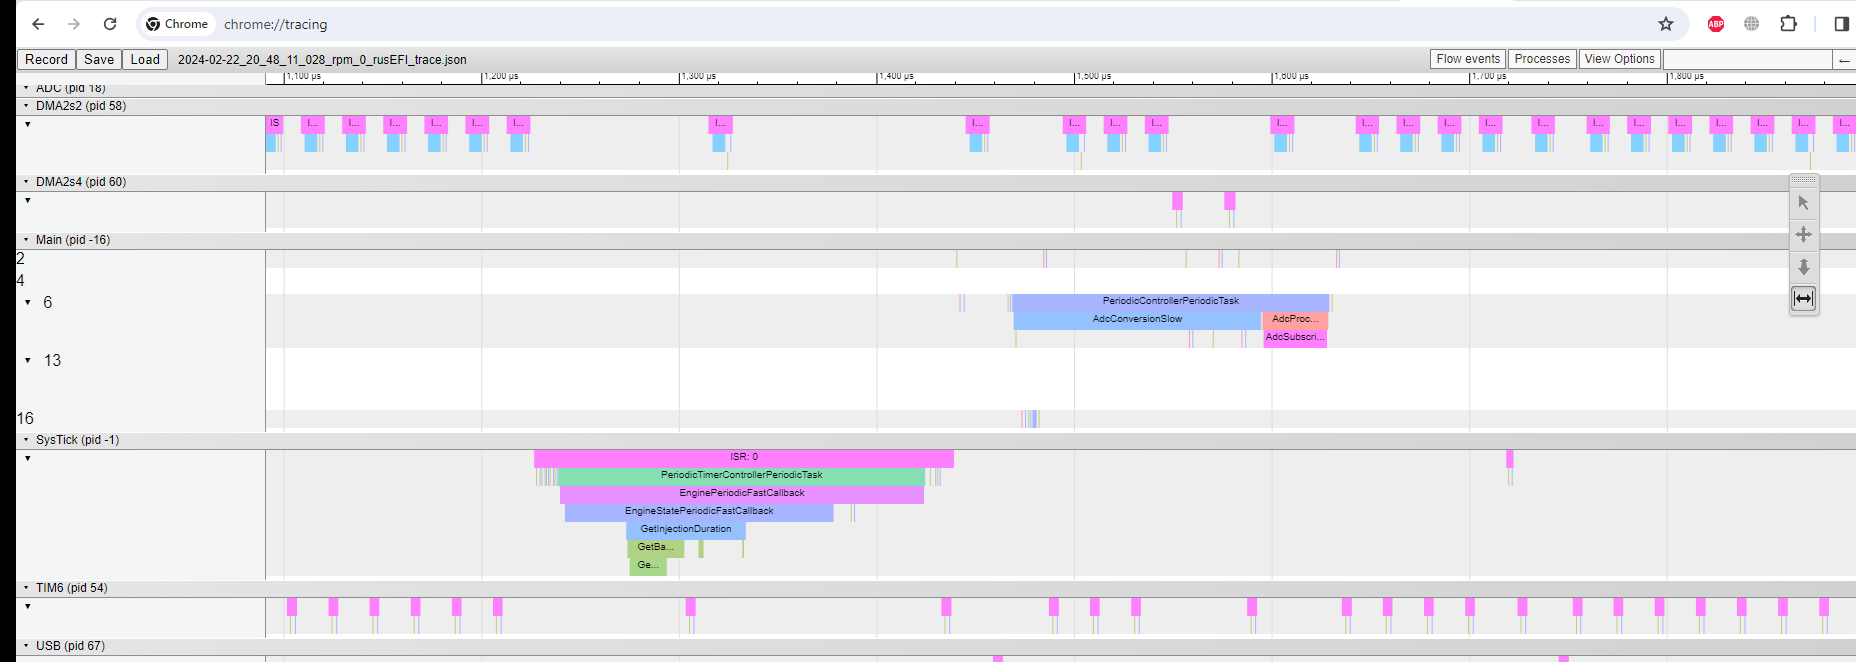
Across the top of the frame are the timestamp in microseconds - this view shows 4700-5200us.
|
|
|
|
Down the left side are a list of processes, which in rusEFI's case, means interrupts. When a particular interrupt occurs, its occurrence is cataloged in the respective row. The interrupt named "main" has multiple sub-headings, since the "main" row isn't an interrupt at all, but is instead normal threads. Each thread gets its own row, with its thread ID (thread names aren't yet supported). Vertical red lines indicate a context switch executed by the operating system when it had to switch from one thread to another, or from a thread to an interrupt.
|
|
|
|
Now, to the actual content of the trace:
|
|
|
|
< image 2 here>
|
|
|
|
This is an example of interrupt #50, which is timer 5, which is used for rusEFI's execution queue. All events scheduled in the future are dequeued by this timer, and reset in oneshot mode for the next event in the queue.
|
|
|
|
The stack of blocks depicts execution as this interrupt occurred. The width of each block represents the duration of that particular event, and if a block is below another, it indicates that it is a child of the block above it. Since these events all trace the execution of a particular function, the trace shows the route execution took through different functions. In this case, `SingleTimerExecutor::doExecute` called `EventQueue::executeAll`, which called `EventQueue::executeCallback`, which called `pwmGeneratorCallback`, and so on.
|